A severity rate is a safety metric that measures how serious workplace injuries and illnesses are by counting the number of lost workdays per 200,000 hours worked. While frequency rates such as TRIR show how often injuries happen, the severity rate shows how much time those injuries cost.
Two companies can have the same number of injuries and very different severity rates. One may have several minor cases with a day or two away from work, while the other has a single case that keeps an employee off the job for months. Looking at severity alongside frequency gives a more complete picture of injury impact.
What Is a Severity Rate?
The severity rate, sometimes called the lost workday severity rate or lost time severity rate, expresses the total number of days lost to work-related injuries and illnesses as a rate based on hours worked. Using a standard base of hours makes it possible to compare sites, business units and years even when the size of the workforce changes.
The severity rate is not a calculation OSHA requires employers to perform or report. It is a management metric. However, it is usually calculated from the same data employers record on the OSHA 300 Log, which tracks the number of days each employee spends away from work and on job transfer or restriction.
The Severity Rate Formula
The most common formula is:
Severity Rate = (Total lost workdays x 200,000) / Total hours worked by all employees
The 200,000 figure is the same base the U.S. Bureau of Labor Statistics uses to compute incidence rates. It represents the equivalent of 100 employees working 40 hours per week, 50 weeks per year. The result is the number of lost workdays per 100 full-time employees in a year.
What Counts as a Lost Workday?
Organizations define lost workdays in different ways, so it is important to document your method and apply it consistently. Common approaches include:
- Days away only: counts only the days employees could not work at all because of an injury or illness.
- Days away plus restricted days: also counts days employees were on restricted duty or transferred to another job.
If you base your count on OSHA recordkeeping data, follow the rules in 29 CFR 1904.7. Days are counted beginning on the day after the injury occurred or the illness began, and they are calendar days, so weekends, holidays and other days off are included when the employee could not have worked them because of the injury. Employers may cap the total days away or restricted for a single case at 180 calendar days.
How to Calculate a Severity Rate Step by Step
- Choose the time period. Most organizations calculate severity rates for a calendar year, with monthly or quarterly rolling figures for trend tracking.
- Total the lost workdays. Add up days away from work, and restricted or transferred days if your definition includes them, for all cases in the period.
- Total the hours worked. Use actual hours worked by all employees, including overtime. Exclude paid time off such as vacation, holidays and sick leave.
- Apply the formula. Multiply total lost workdays by 200,000, then divide by total hours worked.
- Review alongside other metrics. Compare the result with your frequency rates and look at the individual cases that drive it.
Example Calculation
A hypothetical manufacturing plant has employees who worked a combined 400,000 hours in a year. The plant had four cases with days away from work, totaling 120 days.
Severity Rate = (120 x 200,000) / 400,000 = 60
This means the plant lost the equivalent of 60 workdays per 100 full-time employees during the year. If one of those cases accounted for 90 of the 120 days, the rate would mostly reflect that single serious injury, which is why it helps to review individual cases and not just the total.
Average Days Lost per Case
Some organizations also track the average number of days lost per case:
Average days per case = Total lost workdays / Number of lost workday cases
In the example above, 120 days divided by four cases equals an average of 30 days per case. This figure is easier for many audiences to understand and can highlight whether cases are becoming more or less serious over time.
Severity Rate vs. TRIR and DART Rate
Severity rate is often reported with frequency-based rates. Each answers a different question.
- Total Recordable Incident Rate (TRIR): the number of OSHA recordable cases x 200,000 / hours worked. It measures how often recordable injuries and illnesses occur.
- DART Rate: the number of cases involving days away, restricted work or job transfer x 200,000 / hours worked. It measures how often more serious cases occur.
- Severity Rate: the number of lost workdays x 200,000 / hours worked. It measures how much work time those cases cost.
TRIR and DART count cases. The severity rate counts days. A site with a low DART rate but a high severity rate may have few serious cases that each last a long time. A site with a high DART rate but a low severity rate may have many cases that resolve quickly.
Why Severity Rate Matters
- It shows injury impact: lost days often track closely with costs such as wage replacement, overtime, temporary staffing and lost productivity.
- It helps prioritize prevention: hazards that cause long-duration injuries, such as falls and musculoskeletal disorders, may deserve more attention than their frequency alone suggests.
- It reveals return-to-work performance: a rising severity rate with stable case counts may point to delays in treatment or limited transitional duty options.
- It supports benchmarking: it lets organizations compare sites of different sizes on a consistent basis.
Limitations of the Severity Rate
- Outliers dominate: one long-duration case can make the rate swing sharply, especially at small sites.
- Timing issues: days for a case that starts late in the year may continue into the next year, so decide how you will handle carryover and stay consistent.
- Inconsistent definitions: comparing rates across companies is difficult when some count restricted days and others do not.
- It is a lagging indicator: like other injury rates, it reports harm that has already happened. Pair it with leading indicators to understand what is driving results.
- Pressure on reporting: setting aggressive targets for lost days can create pressure to bring injured employees back too soon or to discourage reporting, which is prohibited under 29 CFR 1904.35.
Best Practices for Using Severity Rate
- Write down your definition of lost workdays and apply it the same way every period.
- Report severity rate together with TRIR, DART and the number of cases.
- Review the top cases behind the number, not just the total.
- Use rolling 12-month figures to smooth out short-term swings.
- Pair severity tracking with a strong return-to-work program and timely root cause analysis of serious cases.
- Never use severity targets in ways that discourage employees from reporting injuries or getting treatment.
How SMS360 Helps
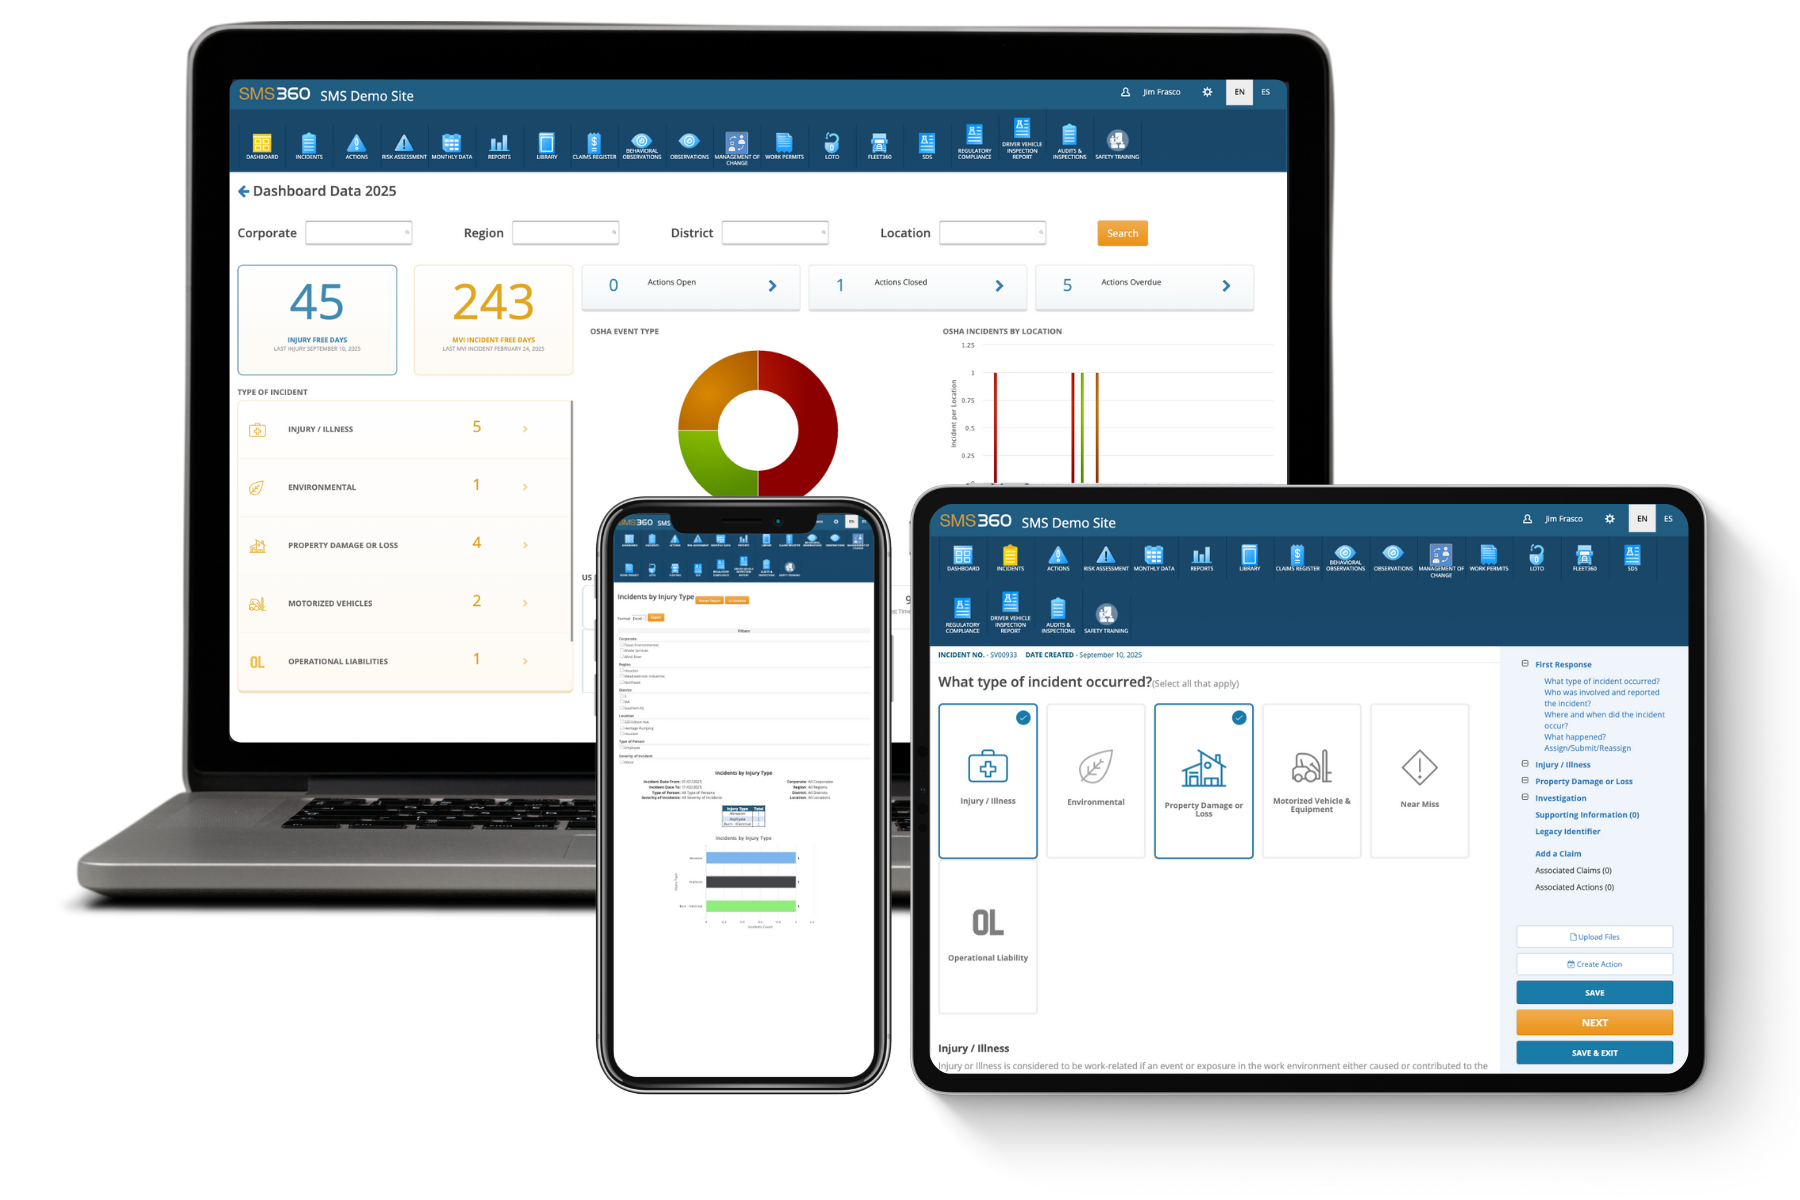
The SMS360 Analytics & Reports module helps safety teams turn incident and hours-worked data into consistent metrics. Teams can track lost workday cases, view trends over time and compare results across sites and departments, so severity can be reviewed alongside frequency measures and the cases that matter most get attention.
Frequently Asked Questions
How do you calculate severity rate?
Multiply the total number of lost workdays in the period by 200,000, then divide by the total hours worked by all employees in the same period. The result is the number of lost workdays per 100 full-time employees per year.
What is a good severity rate?
There is no universal target, because severity rates depend heavily on industry, workforce size and how lost days are defined. The most useful comparison is usually your own trend over time and comparisons between your sites using the same method.
Does OSHA require employers to calculate a severity rate?
No. OSHA requires covered employers to record days away from work and days of restriction or job transfer on the OSHA 300 Log, but it does not require a severity rate calculation. The severity rate is a management metric built from that data.
What is the difference between severity rate and frequency rate?
Frequency rates, such as TRIR and DART, measure how many injury and illness cases occur per 200,000 hours worked. Severity rate measures how many workdays those cases cost per 200,000 hours worked. Together they show both how often harm occurs and how serious it is.