A leading indicator is a proactive safety metric that measures the activities, conditions and behaviors that prevent injuries before they happen. Examples include near miss reports submitted, inspections completed on schedule, hazards corrected within a set time and training completion rates. Leading indicators show whether your safety program is working while there is still time to act.
Most organizations already track injury rates, but those numbers only describe harm that has already occurred. Leading indicators give safety managers and operations leaders an early signal, so they can fix weak spots in the program before they turn into incidents.
What Is a Leading Indicator?
OSHA describes leading indicators as "proactive, preventive, and predictive measures that provide information about the effective performance" of safety and health activities. The definition comes from OSHA's 2019 guide Using Leading Indicators to Improve Safety and Health Outcomes (OSHA 3970), which is the most widely cited US reference on the topic.
In practical terms, a leading indicator counts or times something your people do to control risk. It answers questions such as "Are we finding hazards?", "Are we fixing them fast enough?" and "Are workers trained before they start a task?" Because these activities sit upstream of injuries, a decline in a leading indicator is a warning that outcomes may get worse.
Leading indicators are a type of key performance indicator (KPI). No regulation requires employers to track them, but ISO 45001 clause 9.1 requires organizations to monitor, measure and evaluate their occupational health and safety performance, and leading measures are a common way to meet that expectation.
Leading Indicators vs. Lagging Indicators
A lagging indicator measures events that have already happened. OSHA's guide says lagging indicators "measure the occurrence and frequency of events that occurred in the past," such as injury and illness rates. The total recordable incident rate (TRIR), DART rate and workers' compensation costs are all lagging measures.
Key differences
- Timing: leading indicators measure inputs and activities now; lagging indicators measure outcomes after the fact.
- Control: teams can directly influence leading indicators through daily work. Lagging indicators move only as a result of many factors.
- Volume: leading indicators generate frequent data points. Injury counts at a single site can be too small to show a reliable trend.
- Purpose: leading indicators guide improvement; lagging indicators confirm whether the improvement worked.
The two types work best together. If your leading indicators improve but injuries do not fall over time, you may be measuring the wrong activities or counting activity without checking its quality.
Examples of Leading Indicators
OSHA's guide organizes examples around the core elements of a safety and health program. The examples below are drawn from or adapted from that guide.
Management leadership
- Percentage of managers and supervisors who complete required safety training
- Average time between a worker's hazard report and management's acknowledgment
- Percentage of worker-reported hazards corrected within 48 hours
Worker participation
- Number of near miss and hazard reports submitted per month
- Number of workers involved in developing procedures or job hazard analyses
- Participation in toolbox talks and safety perception surveys
Hazard identification and control
- Percentage of scheduled inspections completed on time
- Percentage of preventive maintenance tasks completed on schedule
- Percentage of incident investigations that include a root cause analysis
- Percentage of hazards abated within the same day, week or month they were found
Training
- Percentage of workers who complete mandatory training on schedule
- Improvement in post-training assessment scores compared with pre-training scores
How to Calculate a Leading Indicator
Most leading indicators are a simple count, a percentage or an average time. Percentages are usually the most useful because they stay comparable as the workload changes from month to month.
The general formula for a completion-based indicator is:
Leading indicator (%) = (activities completed as planned ÷ activities scheduled) × 100
Worked example
A hypothetical distribution center schedules 40 forklift and workplace inspections in March. Supervisors complete 34 of them by the due date.
Inspection completion rate = (34 ÷ 40) × 100 = 85%
The same site logs 25 corrective actions from those inspections, and 20 are closed within 14 days. Corrective action closure rate = (20 ÷ 25) × 100 = 80%. If the site target is 90% for both, the safety manager knows to follow up on overdue inspections and actions before the next month starts, rather than waiting for an injury to expose the gap.
How to Build a Leading Indicator Program
- Start with your risks. Review your injury history, risk assessment results and audit findings to identify the hazards that matter most at each site.
- Pick a small set of indicators. Choose three to six measures tied directly to those risks. A long list dilutes attention and makes data collection a burden.
- Define each indicator precisely. Write down what counts, the data source, who records it, how often it is reported and the formula used.
- Set targets. Use a baseline from a few months of data, then set realistic targets that push improvement.
- Collect data consistently. Use the same forms and systems at every location so results are comparable.
- Review results with leaders. Discuss trends in regular operations meetings, not only in safety committee meetings, and assign follow-up actions.
- Check against outcomes. Every six to twelve months, compare leading indicator trends with lagging results and retire measures that no longer predict anything useful.
Common Mistakes to Avoid
- Measuring activity without quality. Counting 200 observations means little if most are copied checklists. Pair counts with a quality check, such as the percentage of observations that led to a corrective action.
- Tying indicators to rewards that invite gaming. Incentives based on raw report counts can produce low-value reports. Incentives based on low injury numbers can discourage reporting entirely.
- Choosing indicators nobody can influence. Supervisors should be able to move the number through their own actions.
- Never revisiting the list. Once a measure is consistently at target, it may be time to replace it with one that addresses a newer risk.
- Collecting data no one reviews. An indicator only helps if someone looks at it and acts on what it shows.
Best Practices for Using Leading Indicators
Keep indicators SMART: specific, measurable, achievable, relevant and time-bound. Display them where frontline teams can see them, and explain why each one matters. Workers are more likely to report hazards when they see reports lead to fixes.
Balance your set across the program. A good mix covers leadership, worker participation, hazard control and training, so no single element is ignored. Finally, report leading and lagging indicators side by side so executives see both the effort and the result.
How SMS360 Helps
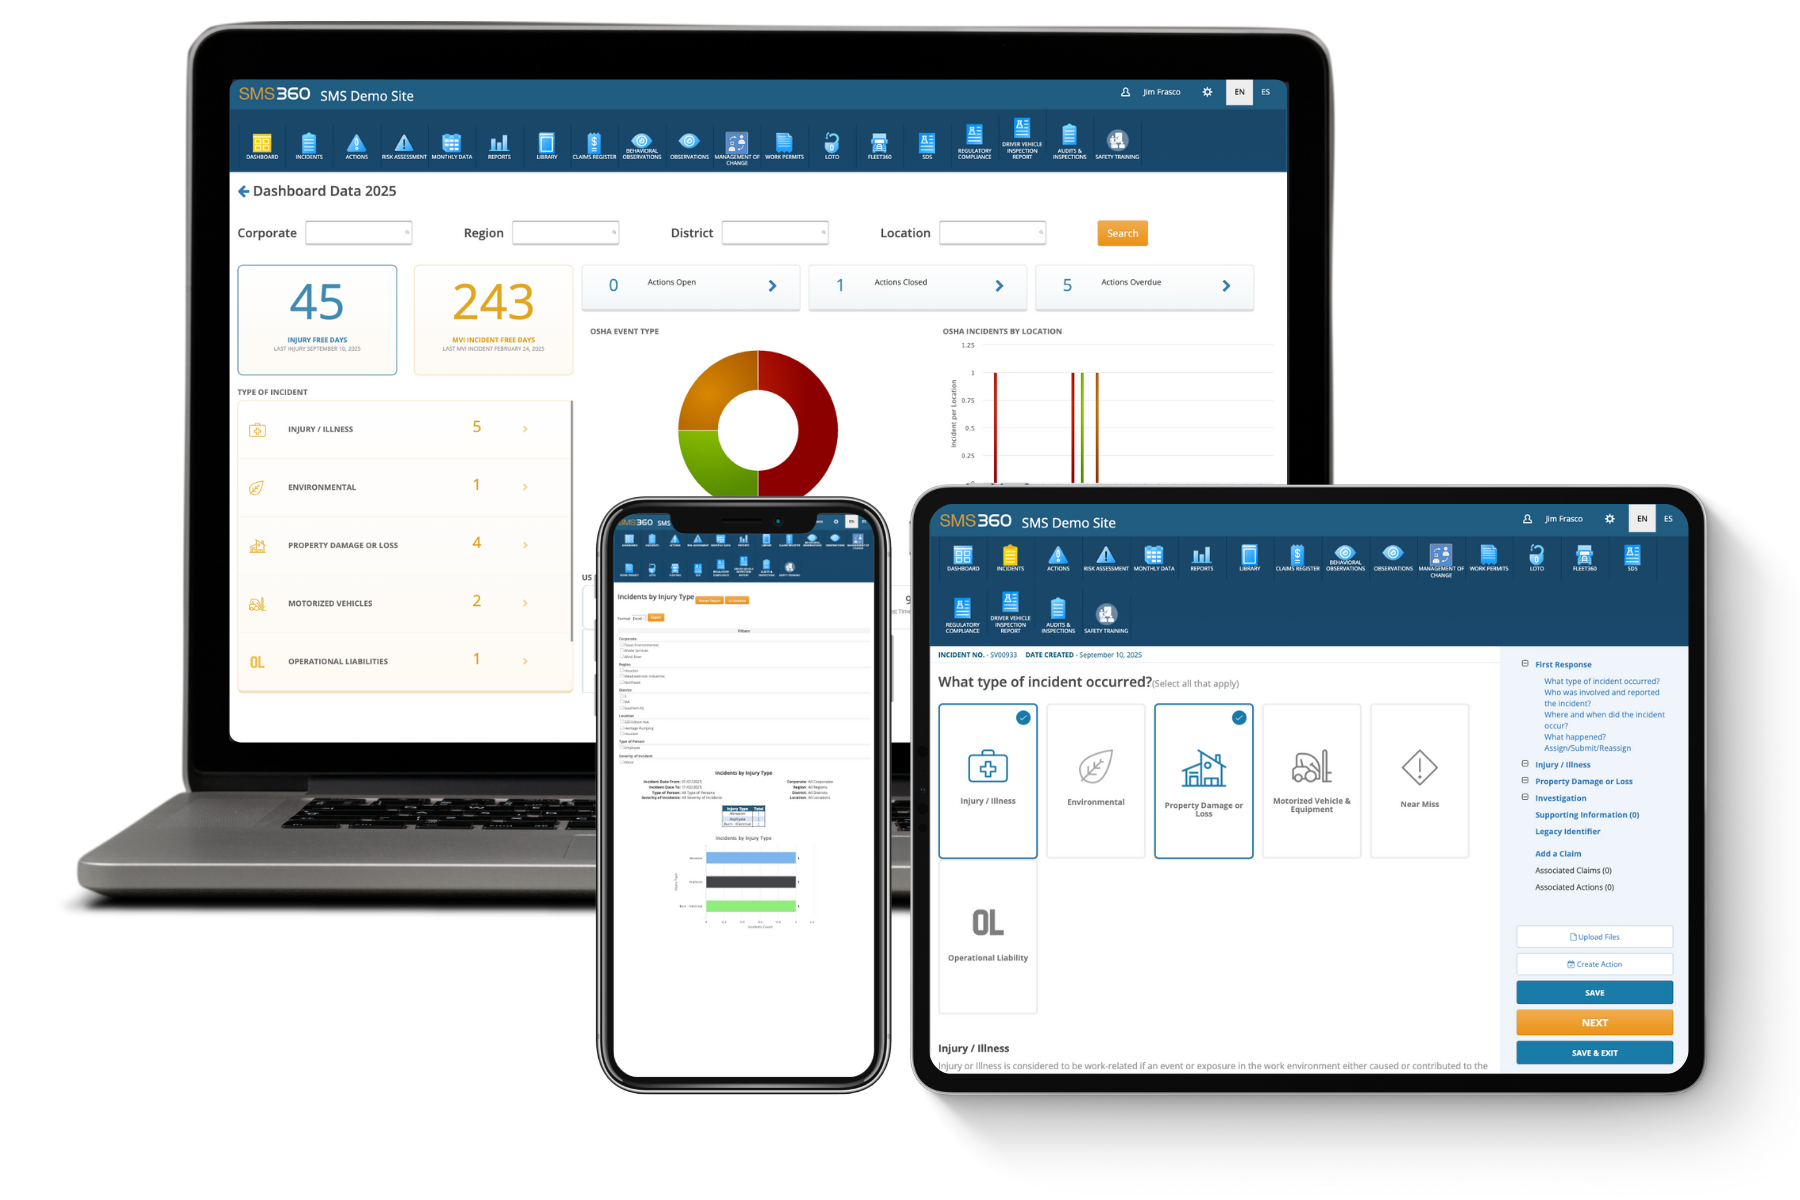
SMS360's Analytics & Reports module brings safety data from across the platform into dashboards and reports. Teams can track leading indicators such as inspections completed, observations submitted and corrective actions closed alongside lagging measures like incident rates. Because records are captured in one system, managers can compare sites, spot overdue work and review trends without compiling spreadsheets by hand.
Frequently Asked Questions
What is an example of a leading indicator in safety?
A common example is the percentage of scheduled safety inspections completed on time. Others include the number of near miss reports submitted, the percentage of hazards corrected within a target period, training completion rates and the share of preventive maintenance done on schedule. Each one measures an activity that reduces risk before an injury occurs, which is what makes it a leading rather than a lagging indicator.
Is TRIR a leading or lagging indicator?
TRIR is a lagging indicator. It counts OSHA recordable injuries and illnesses that have already happened, normalized per 200,000 hours worked. It is useful for benchmarking and showing long-term results, but it cannot tell you what to fix today. Pairing TRIR with leading indicators such as inspection completion and corrective action closure gives a fuller view of safety performance.
How many leading indicators should a company track?
Most organizations do well with three to six leading indicators per site or business unit. That is enough to cover the main program elements without overwhelming supervisors with data entry. Choose measures linked to your highest risks, define them clearly and review them regularly. Add or replace indicators as your risks and performance change, rather than growing the list indefinitely.
Does OSHA require leading indicators?
No OSHA standard requires employers to track leading indicators. OSHA does encourage their use through its Recommended Practices for Safety and Health Programs and its 2019 leading indicators guide. Employers seeking ISO 45001 certification must monitor and measure safety performance, and leading indicators are a practical way to show that the management system is working.