Benchmarking in safety is the practice of comparing your organization's safety performance against a reference point, such as industry averages, peer companies, best-performing sites or your own past results. It helps answer a simple question: are we doing better or worse than we should be, and where should we focus next?
Benchmarks commonly use injury rates such as the total recordable incident rate (TRIR) and DART rate, as well as leading indicators such as inspection completion and corrective action closure.
Types of Safety Benchmarking
- External (industry) benchmarking: comparing your rates with published data for your industry. In the U.S., the Bureau of Labor Statistics Survey of Occupational Injuries and Illnesses publishes annual incidence rates by industry (NAICS) code.
- Peer benchmarking: comparing with similar companies, often through trade associations, insurers or customer prequalification programs.
- Internal benchmarking: comparing sites, departments or shifts within your own organization to find best practices and outliers.
- Trend benchmarking: comparing your current performance with your own results over previous years.
Why Benchmarking Matters
A raw number like "12 recordable injuries" means little on its own. Normalized rates and a meaningful comparison turn it into information leaders can act on. Benchmarking helps set realistic targets, justify investment in high-risk areas, and show customers and insurers how your performance compares with the industry. It also reveals internal best practices that can be shared across sites.
How to Benchmark Safety Performance Step by Step
- Choose the metrics. Pick a balanced set of lagging and leading indicators that matter to your risks.
- Standardize definitions. Use OSHA recordkeeping rules and the 200,000-hour formula so rates are comparable.
- Find the right comparison. Use the BLS rate for your specific NAICS code, not a broad sector average.
- Collect clean data. Verify case counts against the OSHA 300 Log and hours worked against payroll.
- Compare and analyze. Look for the size and direction of gaps, and for patterns by site, task or injury type.
- Act on the gaps. Turn findings into improvement plans with owners and deadlines.
- Repeat regularly. Re-benchmark at least annually, when new BLS data is released or targets are reset.
Example
A hypothetical warehouse has a TRIR of 3.1 and finds that the published rate for its NAICS code is 4.5. It looks strong externally, but internal benchmarking shows that one of its three sites has a TRIR of 6.2, driven by manual handling injuries. That site becomes the focus for ergonomic improvements.
Common Mistakes to Avoid
- Comparing with the wrong industry code or a multi-year average without noting it.
- Treating a low rate at a small site as proof of safety, when one case can swing the rate.
- Benchmarking only lagging indicators, which say little about future risk.
- Using different definitions or hours across sites.
- Setting targets that encourage underreporting rather than real improvement.
How SMS360 Helps
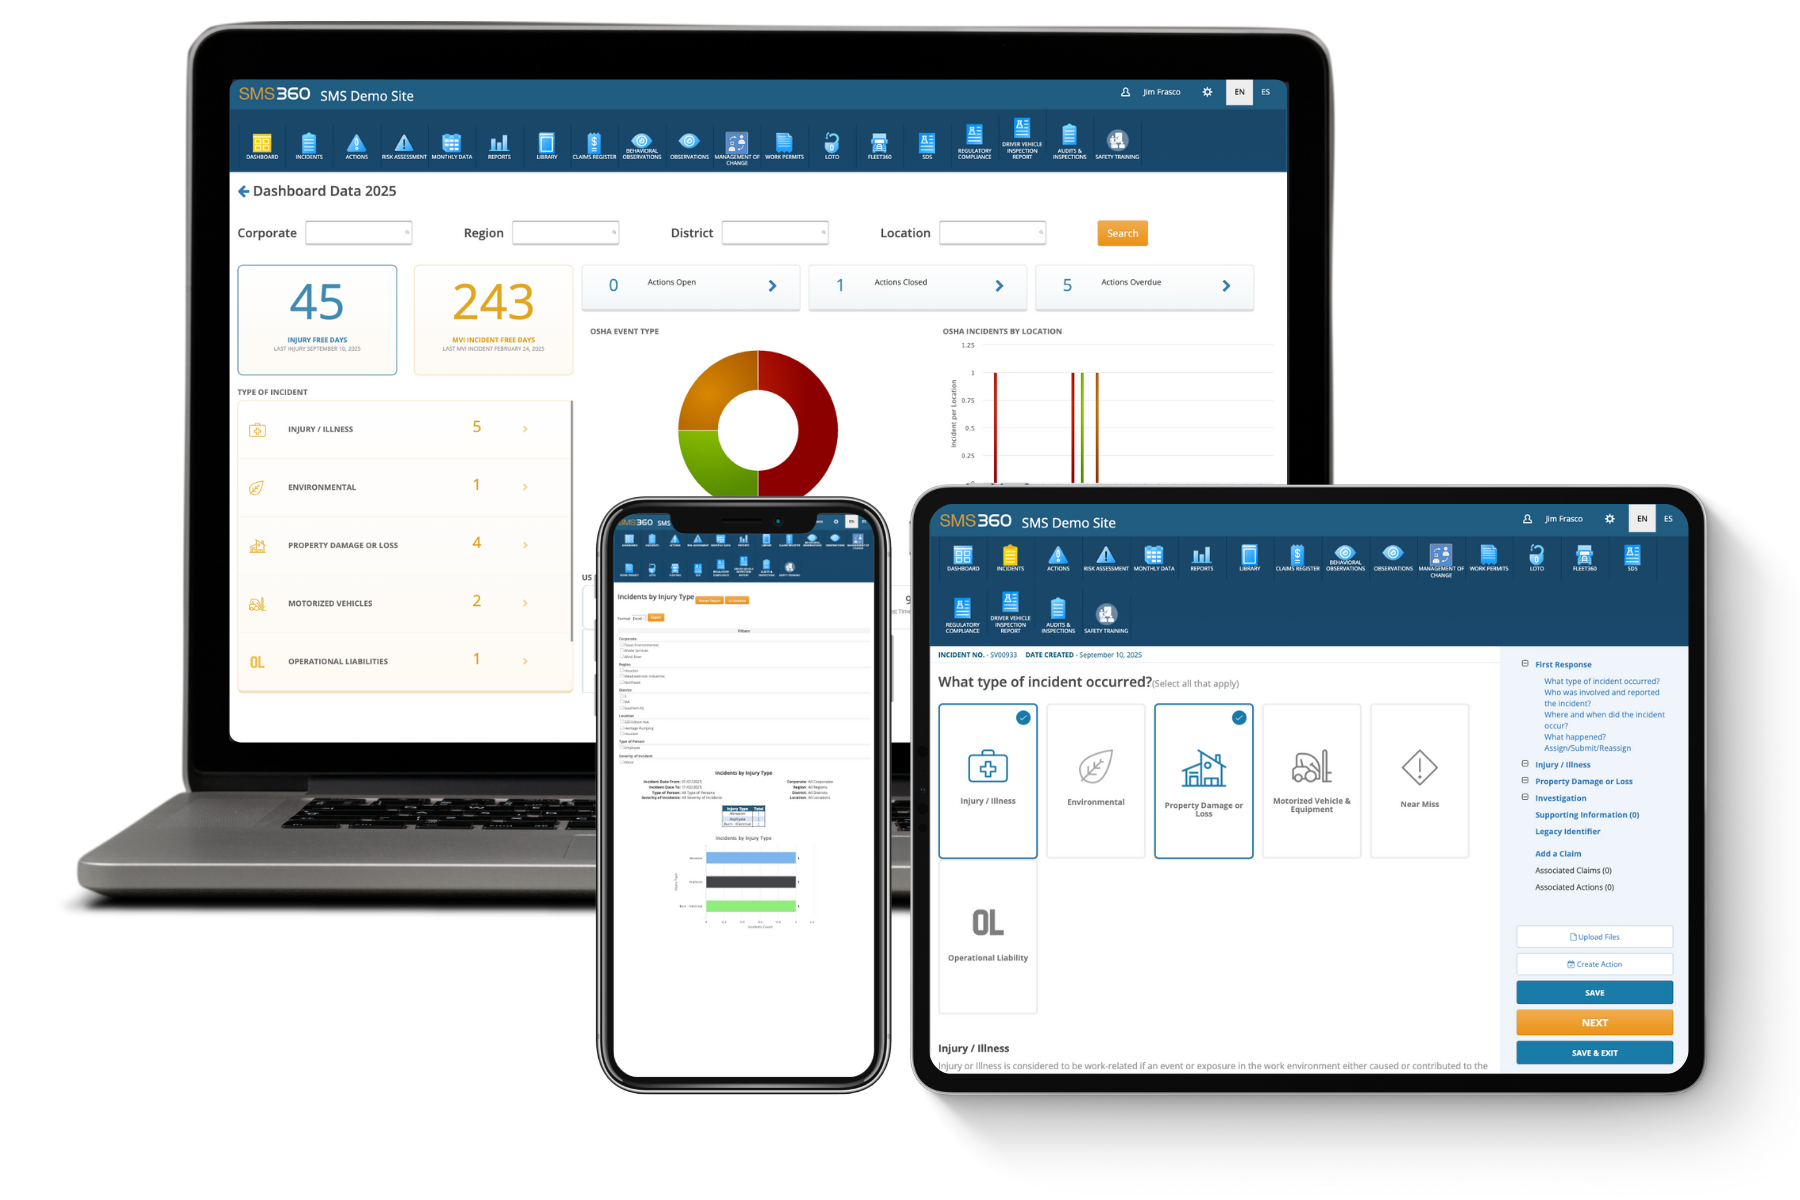
SMS360's Analytics & Reports tools help teams view safety data across sites and time periods in dashboards and reports, making internal and trend comparisons easier. With incidents, inspections and actions in one system, the numbers used for benchmarking come from consistent records.
Frequently Asked Questions
Where can I find industry safety benchmarks?
In the U.S., the Bureau of Labor Statistics publishes annual injury and illness incidence rates by industry through its Survey of Occupational Injuries and Illnesses. Trade associations, insurers and prequalification services also publish peer data for specific sectors.
What metrics should be used for safety benchmarking?
Common lagging metrics include TRIR, DART rate and lost time rate. Useful leading metrics include near miss reporting, inspection completion, training completion and corrective action closure rates. A balanced set gives a more complete picture than injury rates alone.
How often should safety performance be benchmarked?
Most organizations benchmark externally at least once a year, typically when new BLS data is released. Internal and trend benchmarking can be done monthly or quarterly to catch problems sooner.