A lagging indicator in safety is a measure of harm or loss that has already happened, such as injuries, illnesses, fatalities, lost workdays, or workers' compensation costs. Lagging indicators show the outcome of a safety program after the fact, which makes them useful for tracking results and benchmarking, but not for preventing the next incident.
Almost every organization tracks lagging indicators because OSHA recordkeeping, insurers, and customers require them. The challenge is using them well: understanding what they can tell you, what they cannot, and how to pair them with forward-looking measures.
What Is a Lagging Indicator?
OSHA's leading indicators guidance explains that lagging indicators "measure the occurrence and frequency of events that occurred in the past," such as the number or rate of injuries, illnesses, and fatalities. They are called "lagging" because they trail behind the conditions and behaviors that caused the event.
Lagging indicators are outcome measures. They answer the question "How many people were hurt, and how badly?" They do not, on their own, answer "Why?" or "What should we do next?" That is the role of investigation, root cause analysis, and leading indicators.
Examples of Lagging Indicators
Injury and Illness Rates
- Total recordable incident rate (TRIR): all OSHA recordable cases per 100 full-time workers.
- DART rate: cases involving days away, restricted work, or job transfer.
- Lost time injury frequency rate: injuries resulting in time away from work.
- Severity rate: lost or restricted days per set number of hours worked.
- Number of work-related fatalities.
Event Counts
- Recordable injuries and illnesses logged on the OSHA 300 Log.
- First aid cases.
- Vehicle accidents and DOT-reportable crashes.
- Property damage incidents, spills, and releases.
Financial Measures
- Workers' compensation claim counts and costs.
- Experience modification rate (EMR) used by insurers to adjust premiums.
- Lost workdays and associated productivity costs.
Fleet and DOT Lagging Indicators
Organizations that operate commercial vehicles track a parallel set of lagging measures. The most common is the crash rate, usually expressed as crashes per million miles driven so that fleets of different sizes can be compared. Motor carriers regulated by FMCSA must also keep an accident register of DOT-recordable crashes for three years under 49 CFR 390.15. Other fleet lagging indicators include preventable crash counts, cargo and vehicle damage costs, and driver injuries. As with injury rates, these numbers show results but not causes, so they are most useful when paired with leading measures such as completed vehicle inspections and driver training.
How to Calculate Common Lagging Indicators
OSHA incidence rates normalize case counts to 200,000 hours. In a letter of interpretation, OSHA explains that this figure represents 100 employees working 40 hours per week for 50 weeks per year. The formula is:
Incidence rate = (Number of cases × 200,000) ÷ Total employee hours worked
Worked Example
Hypothetical example: a distribution center with about 150 employees worked 300,000 hours last year. It recorded 5 OSHA recordable cases, 3 of which involved days away from work or restricted duty.
- TRIR = (5 × 200,000) ÷ 300,000 = 3.33
- DART rate = (3 × 200,000) ÷ 300,000 = 2.0
The facility had 3.33 recordable cases and 2.0 DART cases per 100 full-time workers. Those numbers can be compared year over year, between sites, or against industry rates that the Bureau of Labor Statistics publishes from its annual Survey of Occupational Injuries and Illnesses.
Use actual hours worked, including overtime, and exclude vacation, holidays, and other paid time off. Using estimated or scheduled hours is a common source of error.
Why Lagging Indicators Matter
Despite their limits, lagging indicators remain essential:
- They are required. Most employers with more than 10 employees must keep the OSHA 300 Log under 29 CFR Part 1904, unless their industry is partially exempt. The annual 300A summary must be posted from February 1 to April 30, and certain establishments must submit injury data to OSHA electronically.
- They show real outcomes. Injuries and illnesses are the harm a safety program exists to prevent. No amount of activity matters if outcomes do not improve.
- They are used by others. Insurers, customers, and contractor prequalification services commonly ask for TRIR, DART, and EMR when evaluating a company.
- They support benchmarking. Because the formulas are standardized, lagging rates can be compared across sites and with industry averages.
- They identify patterns. Analyzing incidents by body part, task, shift, or location points to where prevention efforts should focus.
Limitations of Lagging Indicators
OSHA's guidance notes that lagging indicators can alert you to a failure in your safety program, but only after the failure has occurred. Other limitations to keep in mind:
- They react, not predict. By the time a lagging indicator changes, someone has already been hurt.
- Small numbers are noisy. At a small site, one case can double or halve the rate, making year-to-year changes hard to interpret.
- They can be influenced by reporting culture. A falling injury rate can reflect underreporting rather than safer work, especially when incentives reward low numbers.
- They miss serious potential. A low TRIR does not mean the risk of a fatal or catastrophic event is low. Serious incidents often have different causes than minor ones.
- They do not explain causes. Rates tell you how often, not why. Investigation and root cause analysis are needed to turn data into action.
Lagging vs. Leading Indicators
The difference comes down to timing and purpose:
- Lagging indicators measure past outcomes: injuries, illnesses, and losses. They confirm whether results are improving.
- Leading indicators measure the activities and conditions that come before incidents, such as inspections completed, hazards corrected, near misses reported, and training completed. They give you a chance to act before harm occurs.
The two work best together. Leading indicators show whether prevention work is happening, and lagging indicators show whether that work is producing results. Both are commonly tracked as a safety key performance indicator set on the same dashboard.
Best Practices for Using Lagging Indicators
- Record accurately and promptly. Apply OSHA recordability criteria consistently and enter cases within seven calendar days, as 29 CFR 1904.29 requires.
- Use real hours worked. Pull hours from payroll rather than estimating.
- Look at trends, not single points. Use rolling 12-month rates to smooth out normal variation.
- Break the data down. Analyze by site, department, job, injury type, and cause to find where to focus.
- Investigate every significant case. Each lagging data point is a chance to learn and prevent recurrence.
- Protect reporting. Make sure targets and incentives never discourage employees from reporting injuries. 29 CFR 1904.35 prohibits retaliation for reporting.
- Pair with leading indicators. Choose leading measures linked to your most common or most serious lagging outcomes.
How SMS360 Helps
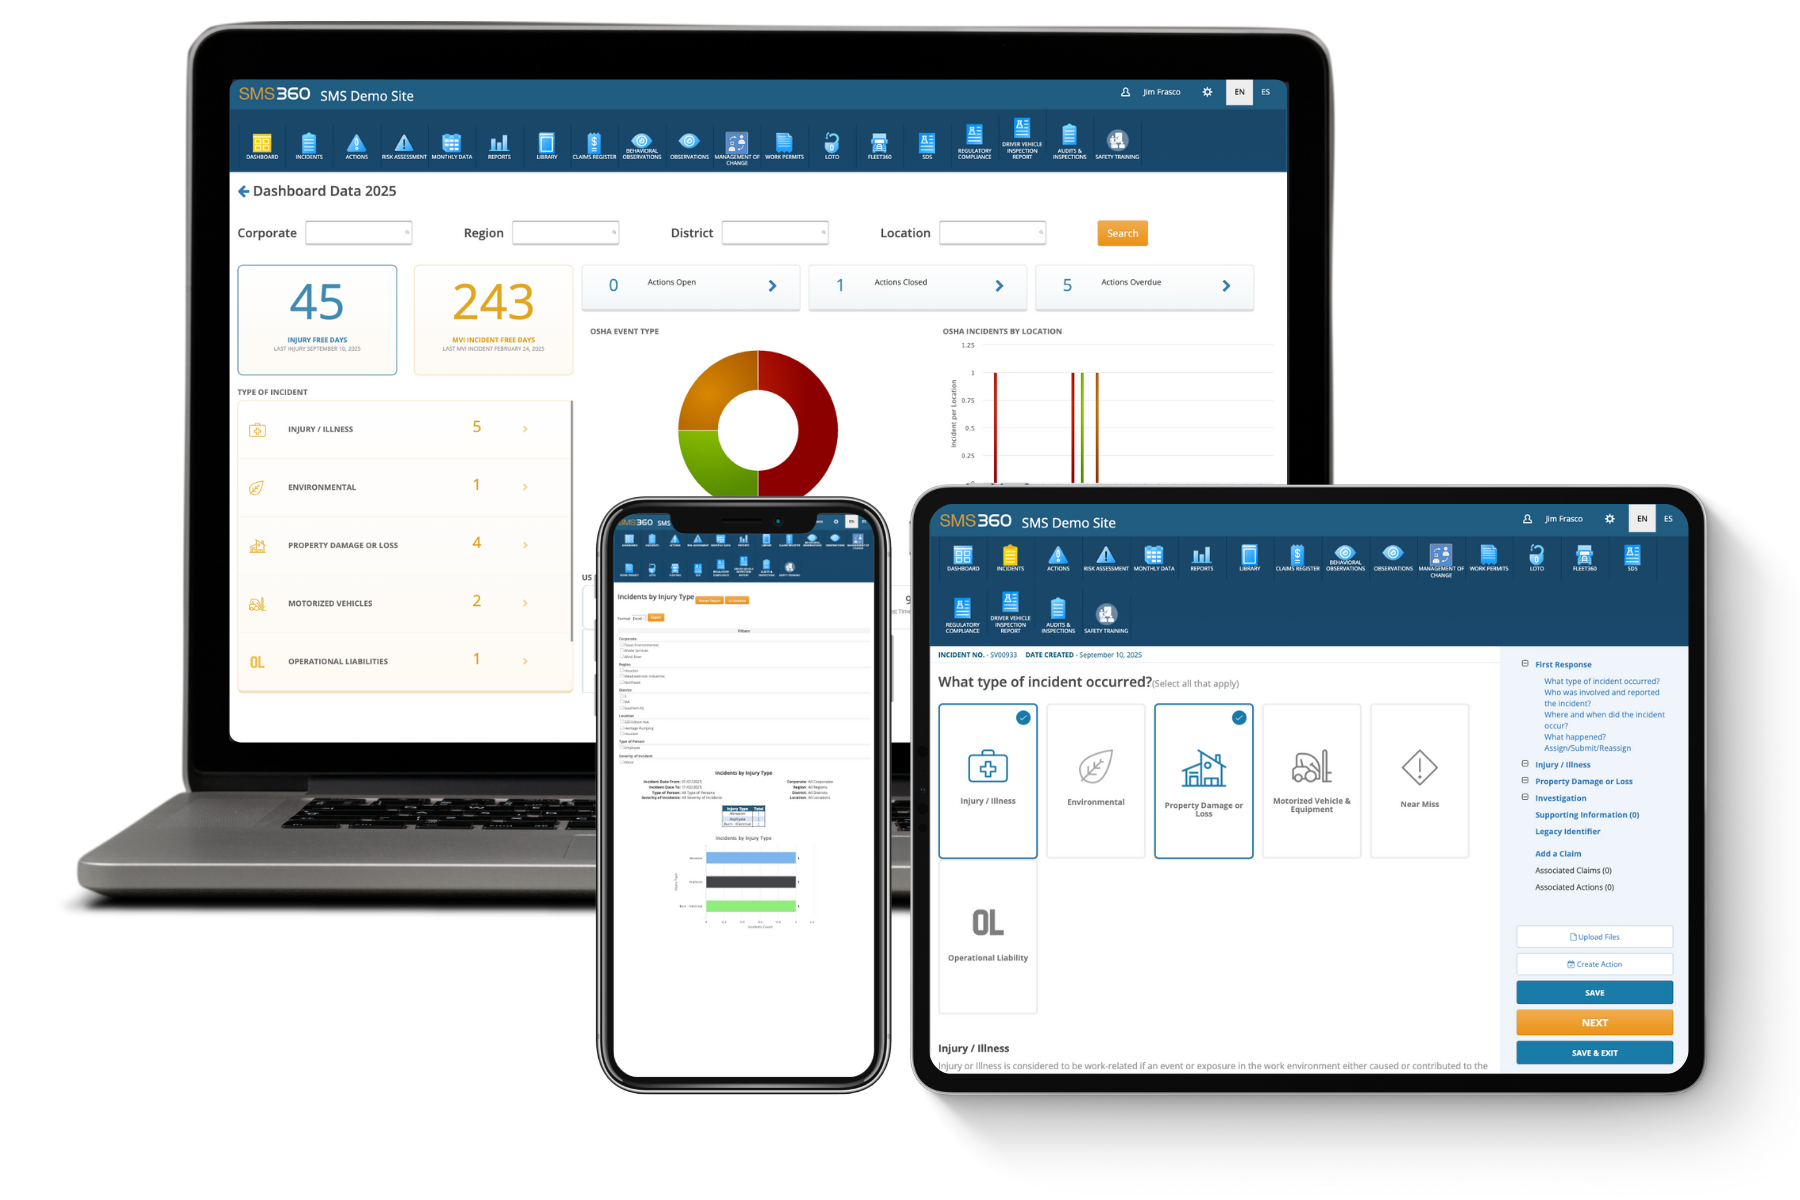
Accurate lagging indicators start with complete incident records. The SMS360 Incident Management module lets employees report injuries, illnesses, near misses, and property damage from mobile devices, and lets safety teams track investigations and assign corrective actions with reminders. Because incident records are kept in one system, teams can review trends on dashboards and produce consistent data for recordkeeping and rate calculations.
Frequently Asked Questions
What are examples of lagging indicators in safety?
Common lagging indicators include total recordable incident rate (TRIR), DART rate, lost time injury frequency, number of recordable injuries, fatalities, first aid cases, vehicle accidents, workers' compensation claims and costs, and experience modification rate. All of them measure harm or loss that has already happened, which is why they are used to track results rather than predict future incidents.
Is TRIR a lagging indicator?
Yes. TRIR is one of the most widely used lagging indicators. It counts OSHA recordable injuries and illnesses that have already occurred and expresses them as a rate per 100 full-time workers per year. It is useful for benchmarking and trend analysis, but because it measures past outcomes, it should be combined with leading indicators that track prevention activities.
What is the difference between a leading and lagging indicator?
A lagging indicator measures outcomes that have already happened, such as injuries or lost workdays. A leading indicator measures actions and conditions that come before incidents, such as inspections, hazard reports, or training completion. Lagging indicators tell you whether your program produced results, while leading indicators tell you whether the work that prevents injuries is being done.
Why are lagging indicators still important?
The injury records behind lagging indicators are required by OSHA recordkeeping rules, the resulting rates are requested by insurers and customers, and they are the most direct measure of whether people are being hurt. They also provide standardized rates for benchmarking against industry data. Their main weakness is that they only show problems after harm occurs, so they are most useful when reviewed alongside leading indicators.