A key performance indicator (KPI) in safety is a measurable value that shows how well an organization is preventing injuries, illnesses, and incidents and how well its safety program is working. Safety KPIs combine lagging measures, such as injury rates, with leading measures, such as inspections completed or hazards corrected on time.
KPIs turn safety from a general goal into numbers that leaders can track, compare, and act on. The right set of KPIs tells you not only whether people were hurt, but whether the activities that prevent harm are actually happening.
What Is a Key Performance Indicator (KPI) in Safety?
There is no regulatory definition of a safety KPI. In general management terms, a KPI is a metric tied to an important objective, tracked over time, and reviewed by the people responsible for results. In occupational safety, KPIs track outcomes (what happened) and the performance of the systems meant to prevent incidents (what you are doing about it).
Safety standards expect this kind of measurement. ISO 45001 requires organizations to set measurable OH&S objectives (clause 6.2) and to monitor, measure, analyze, and evaluate performance (clause 9.1). OSHA's guidance on safety programs likewise encourages employers to track both leading and lagging indicators.
Leading vs. Lagging Safety KPIs
OSHA's leading indicators guidance describes the two main types:
- Lagging indicators "measure the occurrence and frequency of events that occurred in the past," such as the number or rate of injuries, illnesses, and fatalities.
- Leading indicators are proactive and preventive measures that can reveal potential problems in a safety and health program before incidents occur.
A balanced scorecard uses both. Lagging KPIs confirm whether results are improving. Leading KPIs show whether the work that drives those results is being done, and they give you time to correct course before someone is hurt.
How Leading and Lagging KPIs Work Together
Consider a hypothetical warehouse with a rising number of hand lacerations, a lagging KPI. The safety team adds two leading KPIs: the percentage of box-cutting stations converted to safety knives and the percentage of pickers trained on the new tools. Over the following months, the team can see whether conversion and training progress, and whether lacerations fall as those numbers rise. If the leading KPIs reach target and injuries do not drop, the team knows to look for a different cause.
Examples of Safety KPIs
Lagging KPI Examples
- Total recordable incident rate (TRIR)
- DART rate (days away, restricted, or transferred)
- Lost time injury frequency
- Number of first aid cases
- Vehicle accidents per million miles driven
- Workers' compensation claim count and cost
Leading KPI Examples
- Percentage of scheduled inspections and audits completed on time
- Corrective action closure rate within the due date
- Near miss and hazard reports submitted per month
- Training completion rate for required courses
- Average time to respond to a reported hazard
- Safety observations completed per supervisor
- Percentage of job hazard analyses reviewed in the last 12 months
How to Calculate Common Safety KPIs
Injury Rates
OSHA incidence rates use a standard base of 200,000 hours, which OSHA explains in a letter of interpretation represents 100 employees working 40 hours per week for 50 weeks per year. The formula is:
Incidence rate = (Number of cases × 200,000) ÷ Total hours worked
Hypothetical example: a facility records 6 recordable cases in a year and its employees work 480,000 hours. TRIR = (6 × 200,000) ÷ 480,000 = 2.5. That means 2.5 recordable cases per 100 full-time workers per year.
The same formula works for the DART rate, which counts only cases involving days away from work, restricted duty, or job transfer. If 2 of the 6 cases in the example above involved days away or restricted work, the DART rate would be (2 × 200,000) ÷ 480,000 = 0.83.
Some organizations, particularly outside the United States, calculate lost time injury frequency per 1,000,000 hours instead of 200,000. Always state the base you use so rates are not compared incorrectly.
Percentage-Based Leading KPIs
Most leading KPIs are simple percentages. Hypothetical example: 84 corrective actions came due last quarter and 71 were closed by their due date. Closure rate = 71 ÷ 84 × 100 = 84.5%.
Define each KPI precisely before you start tracking it, including what counts, what does not, the data source, and the time period. Otherwise, numbers from different sites or months cannot be compared.
How to Choose and Set Safety KPIs
OSHA's publication Using Leading Indicators to Improve Safety and Health Outcomes suggests that good indicators be SMART: specific, measurable, accountable, reasonable, and timely. A practical process looks like this:
- Start from objectives. Decide what you want to improve, such as reducing hand injuries or improving hazard reporting.
- Pick a small set. Choose a few lagging KPIs for outcomes and a few leading KPIs for the activities most likely to influence them. OSHA advises starting with a small number and adjusting over time.
- Use data you already have. Incident logs, inspection records, and training records are usually the fastest sources.
- Define each KPI. Document the formula, data source, owner, and reporting frequency.
- Set reasonable targets. OSHA notes that a target like 97% attendance is reasonable where 100% is not, since some workers will always be absent.
- Communicate. Share KPIs and targets with workers and supervisors so they understand what is being measured and why.
- Review and act. Review results on a set schedule, investigate unfavorable trends, and assign actions.
- Refine. Drop KPIs that do not drive decisions and add ones that address new risks.
Common Mistakes to Avoid
- Relying only on injury rates. Low injury numbers can reflect luck or underreporting rather than effective controls, especially at small sites where a single case swings the rate.
- Incentives that discourage reporting. Rewards tied to zero injuries can lead workers to hide incidents. OSHA's recordkeeping rule at 29 CFR 1904.35 prohibits retaliating against employees for reporting work-related injuries or illnesses.
- Counting activity instead of quality. Fifty inspections that find nothing may be less valuable than ten thorough ones. Pair counts with quality measures such as findings closed.
- Too many KPIs. A dashboard with dozens of metrics hides the few that matter.
- Measuring without acting. A KPI that nobody reviews or responds to is just a report.
Best Practices for Safety KPI Reporting
- Show trends over time, not just a single month, so you can separate real changes from normal variation.
- Report at the level where decisions are made: site, department, or crew.
- Normalize by exposure, such as hours worked or miles driven, so sites of different sizes can be compared.
- Review leading and lagging KPIs side by side to test whether prevention activities are moving outcomes.
- Assign an owner to each KPI who is responsible for explaining results and proposing actions.
How SMS360 Helps
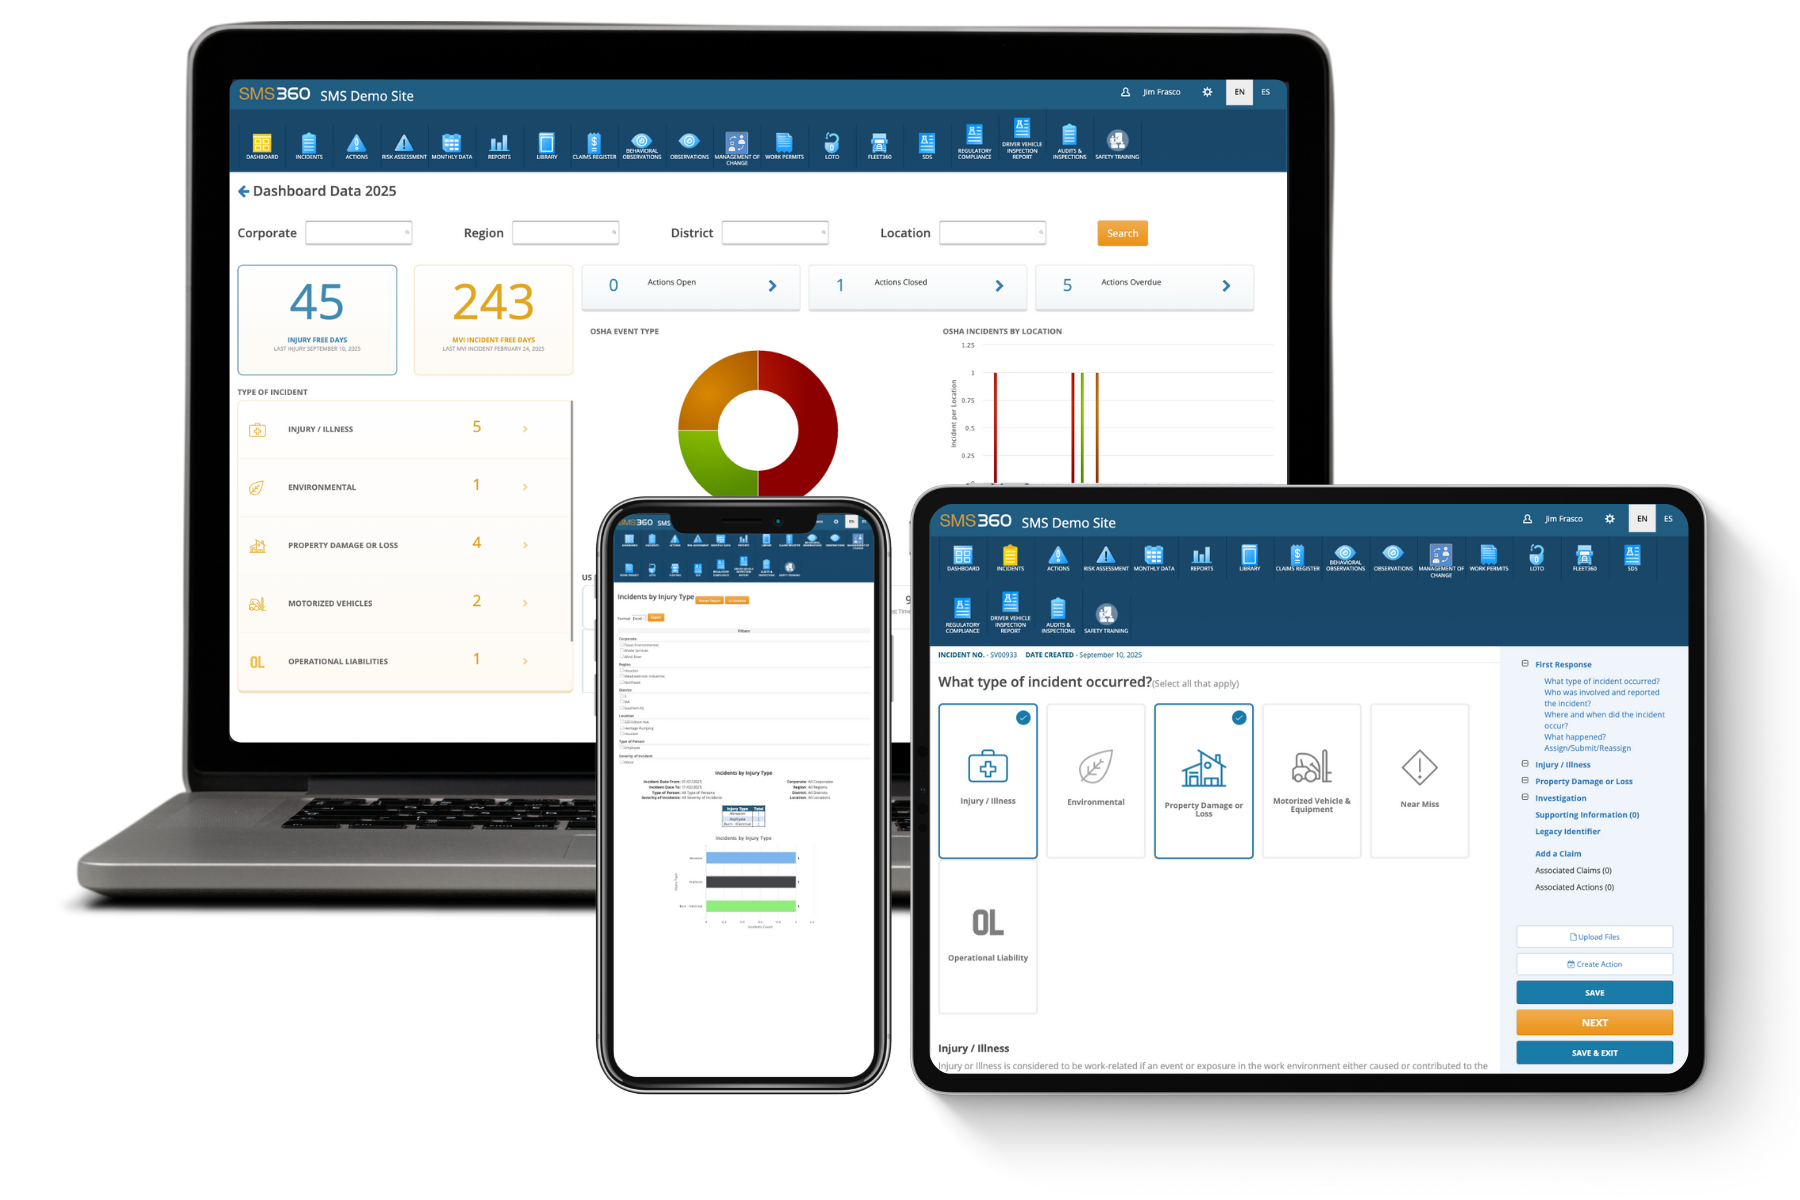
Safety KPIs are only as reliable as the data behind them. The SMS360 Analytics & Reports module pulls information from incident reports, inspections, corrective actions, training, and observations recorded in SMS360 into dashboards and reports. Safety managers can track leading and lagging indicators by site or department, view trends over time, and share consistent reports with leadership without rebuilding spreadsheets each month.
Frequently Asked Questions
What are the most common safety KPIs?
The most common lagging safety KPIs are total recordable incident rate (TRIR), DART rate, lost time injury frequency, and workers' compensation costs. Common leading KPIs include inspection completion rate, corrective action closure rate, near miss reporting rate, and training completion. Most organizations track a mix of both so they can see results and the activities driving those results.
How many safety KPIs should a company track?
There is no required number, but fewer is usually better. Many organizations track a handful of lagging KPIs for outcomes and a handful of leading KPIs for prevention activities. OSHA's leading indicators guidance recommends starting with a small number of indicators and adjusting them over time as you learn which ones actually help you make decisions.
Is TRIR a KPI?
Yes. TRIR is one of the most widely used lagging safety KPIs. It shows the number of OSHA recordable injuries and illnesses per 100 full-time workers per year, using the 200,000-hour base. It is useful for benchmarking and trend tracking, but it should be paired with leading KPIs because it only measures harm after it occurs.
What is the difference between a KPI and a metric?
Every KPI is a metric, but not every metric is a KPI. A metric is any value you measure, such as the number of fire extinguishers inspected. A KPI is a metric you have selected because it is tied to an important objective, has a target and an owner, and is regularly reviewed by leadership to drive decisions.