
Gut instinct and lagging indicators are no longer enough. Here is how safety analytics helps organizations move from reactive to predictive — and why the data you already have is more powerful than you think.
For decades, workplace safety was measured almost exclusively by what went wrong after the fact. Incident rates, lost time injuries, workers' compensation costs — these metrics told organizations how badly they had failed, not how to prevent the next failure. The emergence of safety analytics is changing that fundamentally. By applying data analysis to the full range of safety information organizations collect — incidents, near misses, inspections, audits, training records, observations, and environmental conditions — safety managers can identify patterns, predict risk, and intervene before harm occurs.
This shift from reactive to proactive safety management is not a theoretical aspiration. Organizations that adopt systematic safety analytics are seeing measurable reductions in incident rates, lower compliance costs, and stronger safety cultures. Understanding how to build and leverage safety analytics capabilities is quickly becoming a core competency for safety professionals.
What Is Safety Analytics?
Safety analytics is the systematic collection, processing, and analysis of safety-related data to generate insights that improve decision-making and outcomes. It encompasses a spectrum of analytical sophistication — from basic reporting on incident counts and rates, to trend analysis, to predictive modeling that identifies which work areas, processes, or conditions are most likely to produce an injury before one occurs.
Descriptive Analytics: Understanding What Happened
The most foundational level of safety analytics is descriptive — summarizing and reporting on historical safety data. This includes OSHA recordable incident rates, lost time injury frequency rates, near-miss counts, audit scores, training completion rates, and corrective action closure times. Descriptive analytics establishes the baseline and tracks performance over time. While it is backward-looking, it is the necessary foundation for more advanced analysis.
Diagnostic Analytics: Understanding Why It Happened
Diagnostic analytics goes beyond counting incidents to understanding their causes. Root cause analysis, contributing factor categorization, and causal analysis tools allow organizations to identify patterns in why incidents occur — whether it is a specific type of equipment, a particular time of day or shift, a department with inadequate training, or a process step that consistently produces near-misses. This level of analysis transforms incident data from a compliance record into an actionable improvement tool.
Predictive Analytics: Understanding What Will Happen
Predictive analytics uses statistical modeling and machine learning to identify conditions that are associated with elevated incident risk, before an incident occurs. By analyzing the relationships between leading indicators — inspection findings, near-miss rates, training gaps, behavioral observations — and lagging outcomes like injuries and illnesses, predictive models can flag high-risk conditions and guide proactive intervention.
Key Safety Metrics and KPIs
Lagging Indicators
Lagging indicators measure outcomes — they tell you what has already happened. The most commonly tracked lagging indicators include Total Recordable Incident Rate (TRIR), Days Away, Restricted, or Transfer Rate (DART), Lost Time Injury Frequency Rate (LTIFR), and workers' compensation costs. These metrics are important for benchmarking and regulatory reporting, but because they measure failures that have already occurred, they have limited value as tools for prevention.
Leading Indicators
Leading indicators measure safety activities and conditions that predict future performance. They include near-miss reporting rates, safety observation counts, inspection completion rates and scores, corrective action closure times, training completion rates, and safety committee participation. Organizations with strong leading indicator programs consistently outperform their peers on lagging metrics, because they are actively monitoring and addressing risk before it produces an injury.
Building a Balanced KPI Framework
The most effective safety analytics programs track both leading and lagging indicators, with clear ownership of each metric, defined targets, and regular review cadences. The goal is not simply to report numbers but to use them to drive decisions — identifying which areas of the organization are underperforming, which hazards are trending upward, and which interventions are producing measurable improvements.
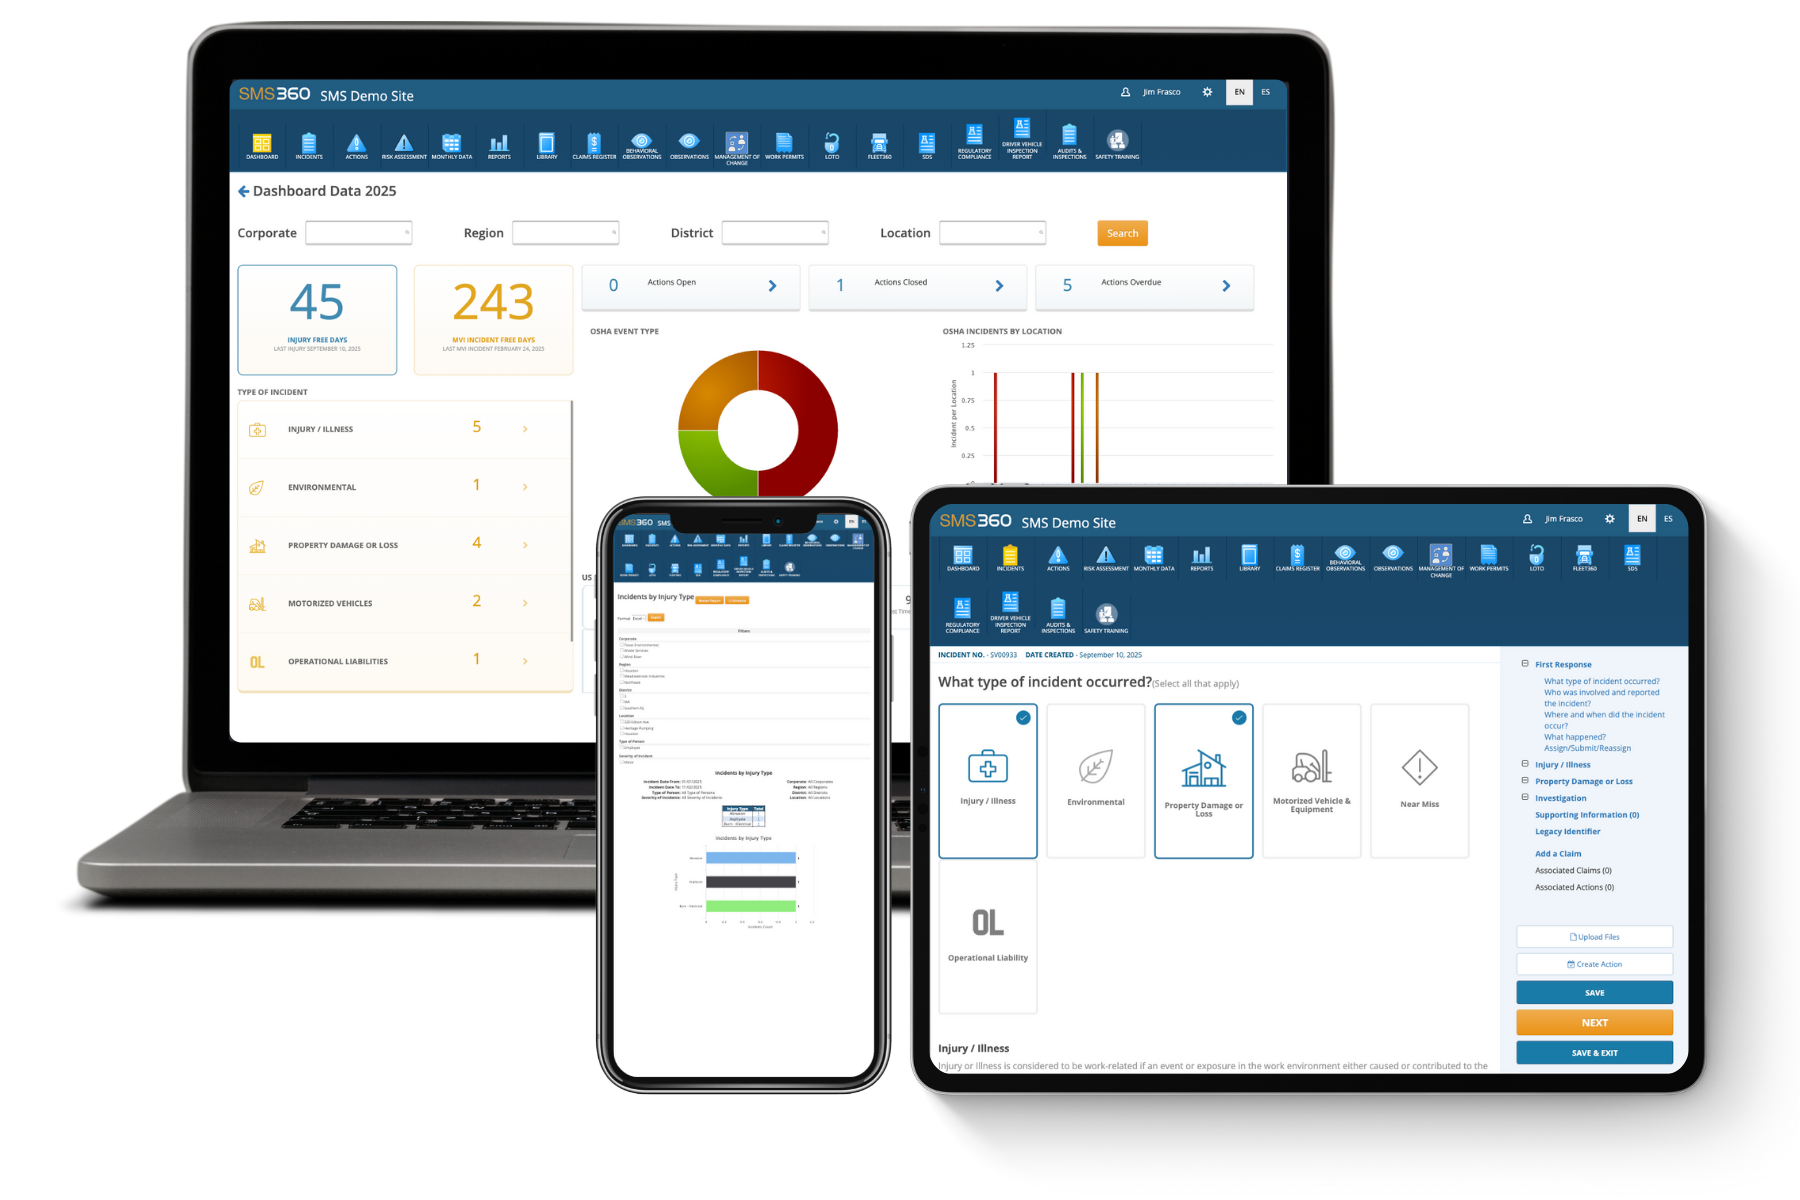
Implementing Safety Analytics With SMS360
SMS360's analytics capabilities give safety managers the tools to track KPIs, uncover trends, and turn safety data into actionable insight. The platform's customizable risk models allow organizations to analyze trends and exposure across their specific hazard profile. Hazards can be ranked by severity and likelihood, giving safety leaders clear prioritization for their prevention efforts. Visual risk reports can be exported for leadership and safety committees, making it easier to communicate performance and justify investment in safety programs.
By centralizing incident data, inspection results, corrective actions, training records, and observations in a single connected system, SMS360 eliminates the fragmentation that makes safety analytics difficult in organizations relying on spreadsheets and siloed databases. When all safety data lives in one place, the patterns that matter most become visible — and actionable.
Frequently Asked Questions
What is the difference between a leading indicator and a lagging indicator in safety?
Lagging indicators measure safety outcomes — incidents, injuries, illnesses, and fatalities that have already occurred. They are called "lagging" because they reflect past performance and cannot be changed. Examples include TRIR, DART rate, and workers' compensation claims. Leading indicators, by contrast, measure the safety activities and conditions that predict future outcomes. They are called "leading" because they occur before an incident and can be influenced to prevent one. Examples include the number of safety observations completed, inspection scores, near-miss reports submitted, and training completion rates. A mature safety analytics program uses both: lagging indicators to understand historical performance and benchmark against peers, and leading indicators to drive proactive prevention.
How many incidents do you need before analytics becomes useful?
This is a common concern, particularly for smaller organizations or those with low incident rates. The honest answer is that even organizations with few recordable incidents can benefit from safety analytics if they are capturing a broad range of data beyond injuries — near misses, unsafe conditions, inspection findings, and behavioral observations. These data points provide the volume needed for meaningful pattern analysis even when OSHA recordable incidents are rare. In fact, organizations that rely solely on injury data for analytics are missing most of the safety information their operations generate. Expanding data collection to include near misses and leading indicators dramatically increases the analytical value of even a small organization's safety program.
What is causal analysis and how does it differ from root cause analysis?
Root cause analysis (RCA) is the process of identifying the fundamental, underlying cause of an incident — the reason that, if addressed, would prevent the incident from recurring. It goes beyond the immediate cause (a worker slipped) to the contributing factors (the floor was wet because a seal had failed) and ultimately the root cause (there was no preventive maintenance schedule for that equipment). Causal analysis is a broader term that encompasses the systematic examination of all factors that contributed to an outcome, often using structured methodologies such as fault tree analysis, fishbone diagrams, or the five whys technique. Both approaches are more useful than simple incident classification because they produce actionable findings that can drive systemic improvements rather than one-off corrections.
How can safety analytics help reduce workers' compensation costs?
Workers' compensation costs are directly linked to incident rates, injury severity, and claim duration. Safety analytics can reduce all three by helping organizations identify and address the conditions that produce claims before they occur. Specifically, analytics that reveal which work areas, job types, or processes are generating disproportionate numbers of claims allow organizations to target their prevention resources most effectively. Trend analysis that identifies increases in specific injury types or hazard categories enables early intervention. And leading indicator monitoring that catches training gaps or inspection deficiencies before they produce an incident can prevent the most costly claims from occurring in the first place. Organizations that have moved from reactive to data-driven safety management consistently report significant reductions in workers' compensation costs over time.
What data should organizations prioritize collecting to improve safety analytics?
The most valuable safety data for analytics purposes includes incident and near-miss data with detailed causal information (not just counts), inspection and audit results linked to specific work areas and equipment, corrective action records including assignment, due date, and actual completion date, training completion records by employee and topic, behavioral safety observations categorized by type of safe or at-risk behavior, and environmental monitoring data where relevant. The quality of analytics is determined more by the quality and consistency of data collection than by the sophistication of the analysis tools. Organizations that invest in making data collection easy — through mobile reporting tools, standardized forms, and simple workflows — generate the data they need to make analytics meaningful.