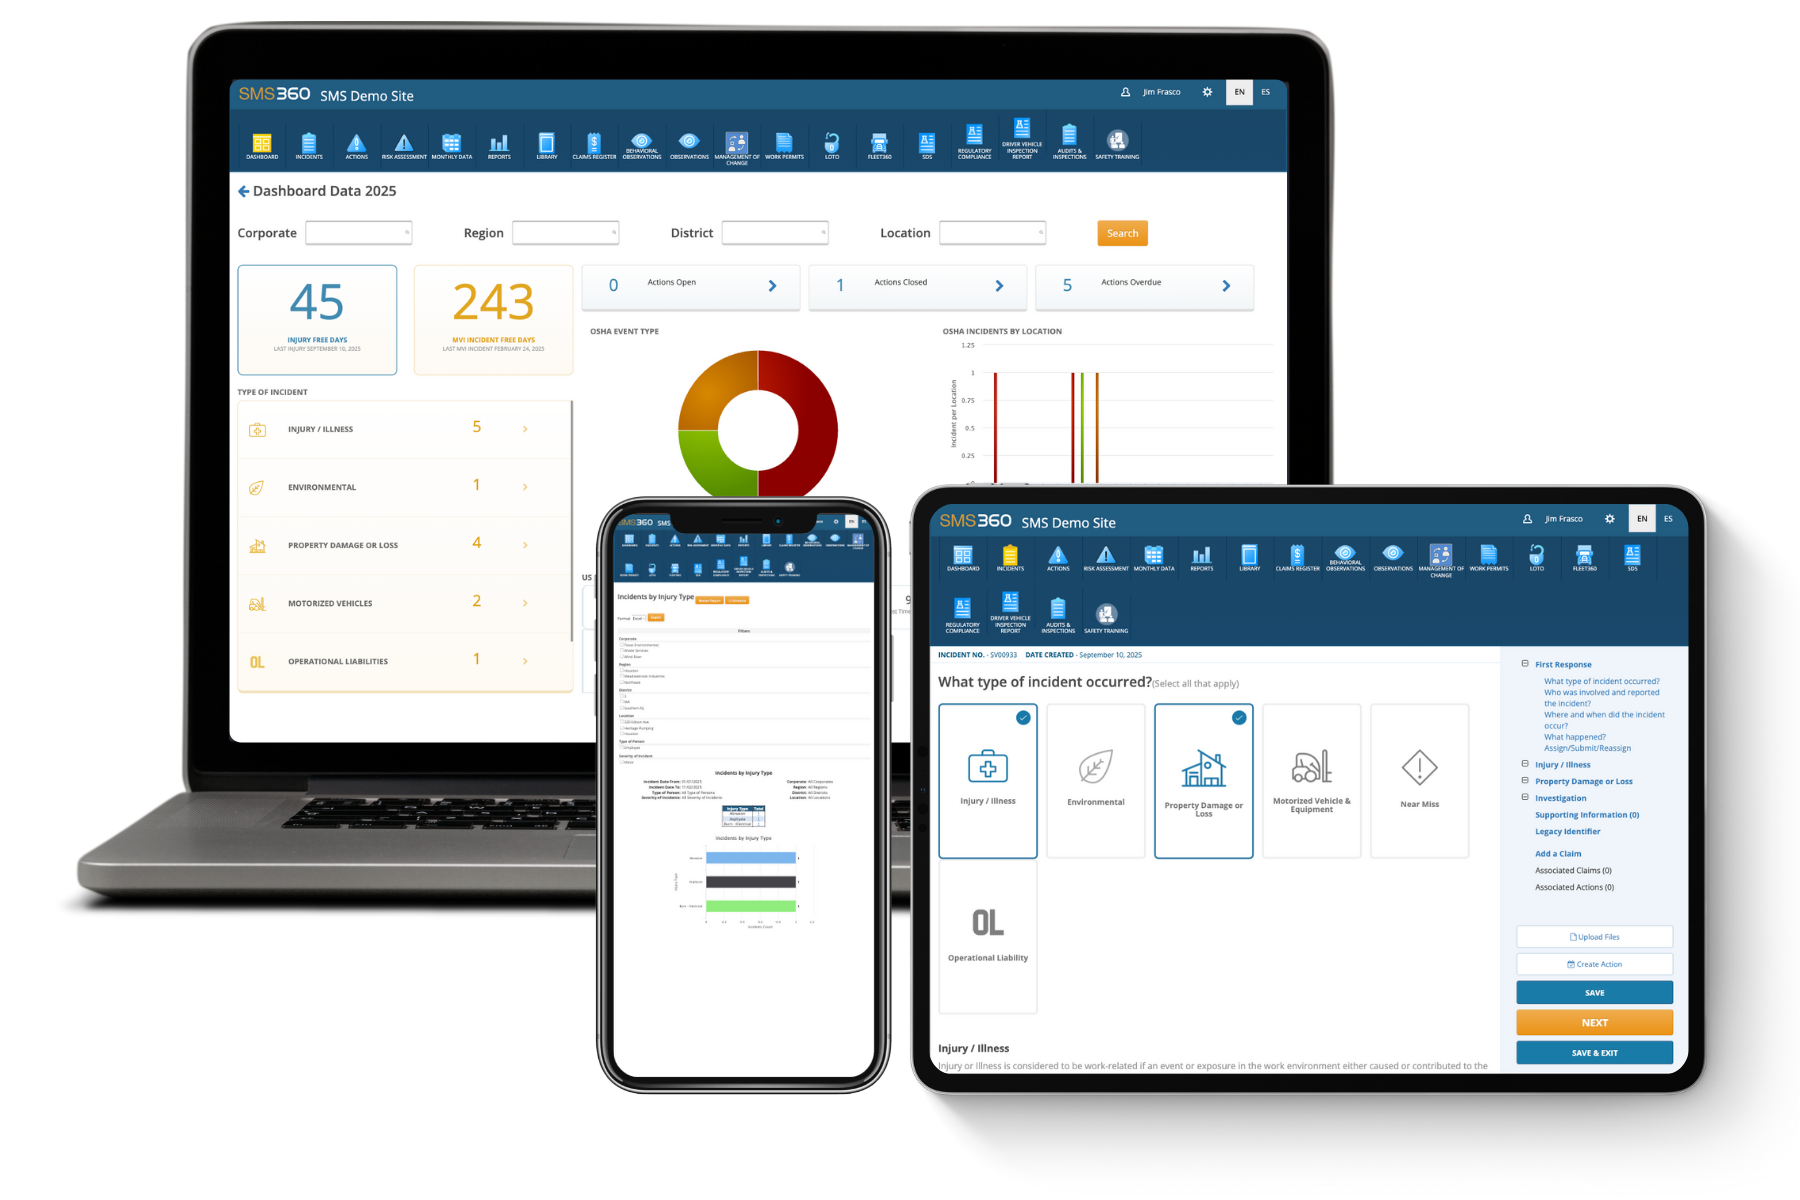

Strong safety programs don’t begin with policies—they begin with measurement. The organizations that consistently track safety data and act on it are the ones that improve faster, reduce operational risk, and create safer environments for employees. Safety metrics provide the visibility leaders need to understand what’s working, where gaps exist, and how safety performance connects directly to productivity, morale, and business outcomes.
Below are five safety metrics proven to support stronger performance across industries and why each one matters.
1. Total Recordable Incident Rate (TRIR)
TRIR is one of the most widely used safety metrics because it helps organizations measure injury frequency in a standardized way. It reflects the number of OSHA-recordable incidents per 200,000 working hours, allowing companies of different sizes to compare performance accurately.
While TRIR alone doesn’t reveal root causes, it provides a reliable baseline for:
- Tracking year-over-year safety progress
- Benchmarking against industry averages
- Identifying spikes in incident frequency
- Communicating performance to stakeholders
A declining TRIR typically reflects improved hazard controls, better training effectiveness, or stronger employee engagement. On the other hand, a rising TRIR signals the need to investigate workplace changes, reporting practices, staffing levels, or operational pressures that may be contributing to increased risk.
TRIR is a lagging indicator, but it’s essential for understanding long-term performance trends.
2. Near Miss & Hazard Reporting Frequency
Near misses are leading indicators—early warnings of unsafe conditions or failed controls. Tracking them is one of the most effective ways to prevent future incidents, but only when employees feel encouraged to report them.
A high number of near miss reports can actually be a positive sign. It often means:
- Employees trust the reporting system
- Workers feel safe speaking up
- Supervisors respond promptly to concerns
- The organization is uncovering issues before they cause harm
Instead of measuring success by having “zero near misses,” high-performing workplaces aim for high reporting and fast response. These numbers reveal whether hazard identification is active and whether the organization is capturing enough information to stay ahead of injuries.
Low reporting rates, on the other hand, often indicate deeper issues: fear of retaliation, unclear reporting processes, or a belief that reporting won’t lead to action.
3. Safety Training Completion & Competency Rates
Training is one of the strongest predictors of safe behavior. But traditional training metrics—like attendance—don’t go far enough. Effective safety programs measure both completion and competency.
Key metrics include:
- Percentage of employees who complete required training on time
- Number of overdue or lapsed certifications
- Pass/fail rates for assessments
- Competency evaluations after hands-on tasks
- Differences in training performance by role or department
When training metrics are high, workplaces tend to see fewer errors, fewer equipment-related incidents, and fewer process failures. When they are low, it often suggests that employees are not fully prepared to handle job tasks safely.
Strong training metrics help organizations identify exactly where more coaching, updated content, or additional resources are needed.
4. Corrective Action Closure Time
Every hazard or unsafe condition identified—whether from a near miss, inspection, audit, or employee report—requires corrective action. Tracking closure time shows how efficiently the organization responds to risk.
Important measurements include:
- Average days to close corrective actions
- Percentage of overdue actions
- Number of high-risk hazards awaiting resolution
- Recurring issues that return after closure
- Departments with the longest closure delays
Fast closure times reflect a culture that prioritizes safety and holds teams accountable. Delays, especially for high-risk issues, increase the likelihood of preventable incidents.
Corrective action metrics often reveal patterns that may not show up in incident data. For example, a department with a low TRIR might still have a large backlog of overdue corrective actions—indicating that the department is simply “getting lucky” rather than operating safely.
5. Audit & Inspection Findings
Audits and inspections serve as another leading indicator by evaluating the safety conditions of equipment, facilities, and processes. Tracking these findings helps organizations monitor risk levels before injuries occur.
Valuable audit metrics include:
- Number of issues identified per inspection
- Severity levels or risk scores of findings
- Percentage of repeat findings
- Inspection completion rates
- Corrective action progress tied to audits
If audit findings decrease over time, it usually means controls are improving and employees are becoming more consistent in following safety procedures. If findings increase or repeat, it often signals systemic issues such as outdated processes, lack of training, or insufficient supervision.
Audit data gives leaders a measurable way to understand whether the safety program is being implemented consistently across the organization.
Why These Safety Metrics Improve Workplace Performance
Tracking these five metrics does more than improve compliance. It directly influences operational performance in several key ways:
1. Better Decision-Making
Metrics provide objective information leaders can use to allocate resources, adjust processes, and prioritize improvements. Without data, decisions rely on assumptions or incomplete observations.
2. Higher Employee Engagement
When employees see their reports and feedback turning into action, trust increases. Engaged employees participate more, follow procedures more consistently, and help reinforce safety culture.
3. Reduced Incident Costs
Injuries come with financial costs, lost productivity, investigation time, and administrative workload. Strong safety metrics allow organizations to intervene earlier, preventing both direct and indirect losses.
4. Stronger Operational Consistency
Metrics highlight gaps between policy and practice. Identifying inconsistencies early ensures procedures are followed the same way across teams, shifts, and locations.
5. Increased Predictability and Stability
A workplace with fewer disruptions—from incidents, injuries, or equipment failures—operates more smoothly. Safety metrics provide the visibility needed to maintain predictable operations.
Building a Safety Measurement Approach That Works
The most successful organizations follow a simple framework:
- Track consistently: Data should be updated regularly, not sporadically.
- Communicate openly: Share insights with employees so they understand progress.
- Act quickly: Metrics only matter when they lead to action.
- Review trends over time: One month of data isn’t enough—patterns tell the real story.
- Adapt as needed: As operations evolve, safety metrics should evolve, too.
When organizations treat safety metrics as ongoing tools—not one-time reports—they gain the clarity needed to reduce risk and improve overall performance.
Conclusion
These five safety metrics—TRIR, near miss reporting, training performance, corrective action closure time, and audit findings—give workplaces the insight they need to stay proactive, prevent injuries, and operate more efficiently. By combining leading and lagging indicators, organizations can build a complete picture of their safety environment and strengthen performance across every department.